Google Analytics is a popular and powerful tool that is actually unknown by many people. For some, it is known but always misunderstood. Like everyone else, my first encounter with Google Analytics was as blur as a sandstorm. It took me about a month to confidently admit that I’m aware of what’s going on with my Analytics report.
Remember guys, no matter how many articles and blogs you feed your brains, you’ll never be confident that what you’re doing is 100% right until you’ve completed it with the understanding that you did everything correct.
Plus, the idea that you know how to do it. Let this simple “Google Analytics reporting” advice help you be confident that all your efforts make sense and your reports are not just patterned documents.
I suppose you’ve already integrated Google Analytics on your website, so the next step is to know the key metrics that will be useful and which ones are not.
Of the many information that Google Analytics can give you, here are 5 essential ones that you should pay attention to:
1. Conversion Rate
Let’s start with the most difficult feature I knew in analytics reporting, the Conversion Rate! Yes, it’s easy to understand that it is actually the rate of a conversion, but what is it for? Why should it be on your report?
Honestly, I used to ignore this result and just pretended I mistook its changes. Don’t be stupid to disregard this feature, because its worth can be compared to how many of the product you sell turned into actual money. First, you need to set up “Goals” for your site. Base your goals on what type of website you run.
The purpose of goals is to give you a conversion rate. This can help you track how many of your visitors turned into customers or leads. Want to learn more? here’s a list of Conversion Rate Optimization Ideas you should consider adding to your Blog Strategy
2. Traffic per Sources/Medium
Traffic Sources is probably the easiest Google Analytics result to understand. If by chance, you don’t have any idea what this means, it’s actually the overall number of visitors who visited your site from different sources. There are four sources that your site can receive traffic from – Search Traffic, Referral traffic, Direct Traffic and Campaigns.
Search traffic – number of visits that are generated from search engine queries
Referral traffic – number of visits that are produced from site links on other websites
Direct traffic – number of visits that came from directly entering the site URL into the browser
Campaigns – number of visits that are generated from email campaigns
Traffic sources will show you the breakdown of details on which site or keyword/s your website is generating more visitors. This can help you identify which keyword you should optimize more and which type of traffic source you should pay more attention to.
3. New and Returning Visitors
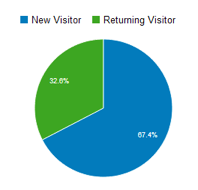
 Another information you should keep an eye on is the number of your New and Returning visitors. It’s not just a plain information that Google Analytics gives you, just to tell you your website is actually attracting more and more visitors or the other way around. It actually shows you how effective your campaigns and your keyword optimization are. Also, it gives you insights that there are things that you need to improve on your site to increase your traffic.
New visitors are the ones who had their “first time” visit to the site. These are the people who you should impress at their first look and engage them on their first visit. In this way, they will become your Returning Visitors, who for the second, third, or fourth time, visit your site for your products. So, it’s time to work on your templates, content and keywords. Your site speak of what quality of services you offer.
4. Bounce Rate
The Bounce Rate is the percentage of visitors who visited a single page and left the website without visiting any other pages. It is basically measured for Landing Pages.
Bounce rate is a good metric to use because it shows if you are getting the right users. High bounce rate could mean users that are not from your target market or maybe the web pages are just bad! This metric needs to be adapted based on the kind of website, too.
5. ROI
Last but not the least, the most important metric you should pay attention is the ROI or Return On Investment. The basic formula on how to get it is ROI = Revenue – Cost. Well, this is actually the point of all these. We use Google Analytics to see if we’re actually generating sales/leads from websites.
Among all the metrics in Google Analytics, these 5 are the ones on top of my list. Which Google Analytics metrics do you find as the most useful? Share some insights on the comment box below.


